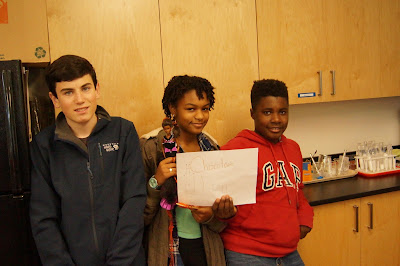
As introduced in the post, Snapshot: 8A Barbie Bungee Jump, the eighth grade applied their knowledge of linear functions to a Barbie bungee jump challenge. The intent of the project was to provide a real world application of linear functions to ground student understanding. Students were divided into groups of two or three to do some introductory experimentation with a Barbie, up to three rubber bands, and a meter stick. Here are all the bungee jump groups with their test Barbie and company name.
Groups plotted their data two ways: by hand and using the an online regression tool. Using their math skills they drew a line of best fit and did their best to estimate the slope of the line. Once they had their calculations figured out, they plotted their data on regression tool and it gave them a linear equation. They had to figure out what the slope and y-intercepts represented in this scenario and use these data points to decide how many rubber bands to add to their bungee rope.
We had to wait patiently for a dry day to perform our bungee jumps. Jump day was thrilling. They students made their initial jumps and then modified their numbers one last time. Here are some photos from jump day.
We experimented with filming and photography of the event. There were a couple of GoPros and lots of iPhone footage. Our favorites were the slow-motion jumps taken from the ground.For our final jump, we had all Barbies jump simultaneously. It was a great way to make a direct comparison of all the bungee cords.
Student reflection and feedback gave me insights into how to improve upon this activity. Fun was had by all and we made math come to life!
Thank you to all the people who shared their Barbies for us to use and to B. Hansen for the great video clips.


