Showing posts with label algebra. Show all posts

Sunday, September 3, 2017

Snapshot: 7A/7C Data and Representation


The seventh-grade classes began the school year by exploring the different ways data can be represented. We collected three different data sets: birth date, bed time vs. wake-up time, and favorite ice cream flavor, topping, and container. Observations and deductions were made on the first two data sets. Students made astute observations and deduced information about the classes based on the data. They made predictions about how adding the data from 7B might change or re-enforce our observations and deductions. We invited 7B to share their data with us too. We discussed the value of representing data in visual formats and how it can help us find patterns that may not be evident in the raw data form.

For the favorite ice cream flavor, topping, and container data, groups of students were asked to represent the data collected in a graphic manner. Students had to grapple with deciding which data to include, how to sort or organize the data so it was easier to consume, and which tool or strategy would best communicate the information. The diversity of representation was impressive.  A small sampling is located below. Please stop by the upper hallway in the Athena building to take in the rest of the posters. We discussed how the same data set can be distilled in so many different ways. I hoped to illustrate that graphs and data sets can be helpful, but we must be careful to ask questions like: Which data was used? Which data was left out? What is the point of view that is being shared or promoted?

We will practice our observation skills and make sense of patterns and representations throughout the year as we make our way into algebra and algebraic thinking. 


Wednesday, January 25, 2017

8A: Barbie Bungee Jump - Explore More


As introduced in the post, Snapshot: 8A Barbie Bungee Jump, the eighth grade applied their knowledge of linear functions to a Barbie bungee jump challenge. The intent of the project was to provide a real world application of linear functions to ground student understanding.  Students were divided into groups of two or three to do some introductory experimentation with a Barbie, up to three rubber bands, and a meter stick.  Here are all the bungee jump groups with their test Barbie and company name.


Groups plotted their data two ways: by hand and using the an online regression tool. Using their math skills they drew a line of best fit and did their best to estimate the slope of the line. Once they had their calculations figured out, they plotted their data on regression tool and it gave them a linear equation. They had to figure out what the slope and y-intercepts represented in this scenario and use these data points to decide how many rubber bands to add to their bungee rope.

We had to wait patiently for a dry day to perform our bungee jumps. Jump day was thrilling. They students made their initial jumps and then modified their numbers one last time.  Here are some photos from jump day.


We experimented with filming and photography of the event.  There were a couple of GoPros and lots of iPhone footage. Our favorites were the slow-motion jumps taken from the ground.For our final jump, we had all Barbies jump simultaneously.  It was a great way to make a direct comparison of all the bungee cords.


 Student reflection and feedback gave me insights into how to improve upon this activity. Fun was had by all and we made math come to life! 

Thank you to all the people who shared their Barbies for us to use and to B. Hansen for the great video clips. 

Snapshot: 8A Barbie Bungee Jump


Students are always asking,"When will I ever use this?" in math class. I do my best to give them real world contexts for the skills they are learning. In the 8th grade, we began the year learning about linear functions and figuring out how to graph them. To help make these skills real, the students did an activity where they had to use linear functions to figure out how many rubber bands a Barbie required to get the most thrilling bungee jump off QLab 201's balcony (16 feet).  Thrilling was defined as getting as close to the ground without actually touching the ground.  Here is a compilation of shots from our jump day. 

Thank you to Blake Hansen for the video footage and editing.


If you wish to read more about this adventure or see more photos and video, check out: 8A Barbie Bungee Jump: Explore More.

Wednesday, November 2, 2016

Snapshot: 8A Equations of Lines

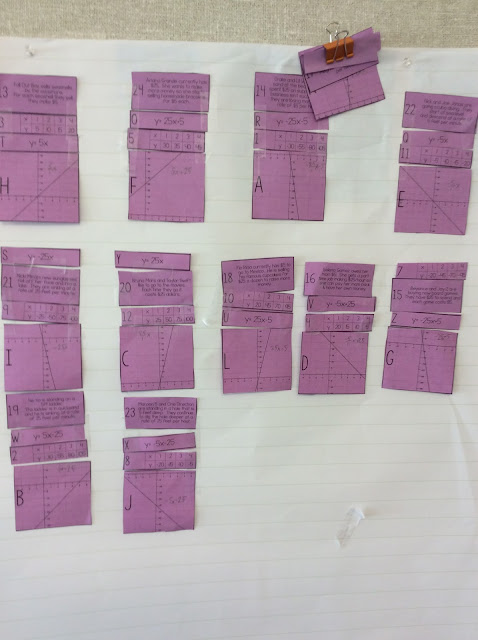
Much of the fall was spent working with various forms of a line. The class saw different representations of lines: tables, graphs, equations, and word problems. In this activity, the class was split into groups and they had to match a table with an equation, a graph, and a story problem. They are working to understand the relationship between these representations and know when each type is useful. There was lots of great discussion and testing of understanding as the activity progressed. 

Next, we are getting ready to solve systems of linear equations!

Saturday, February 6, 2016

Snapshot: 8A Documenting the Process

One of the great challenges that my students face in math class is documenting their thinking on paper. Most students are resistant to taking the time to show their work in detail. It is difficult to capture all of the decisions and step that are required to show someone how they achieved their result. Every so often, students are able to capture their thinking in a clear, detailed, and concise manner. These are two exemplar samples of what we hope every student can achieve. 

The eighth grade is learning how to factor polynomials. We began the journey by learning how to multiply monomials, binomials, and polynomials. The class spent several periods looking for the clues on how to factor a trinomial in the form of a^2+bx+c. To solidify their learning, they were asked to write out the steps to teach someone how to factor this type of trinomial. Many found this task difficult because they struggled to generalize the steps. Most could tell you what to do with a specific example, but not how to do it without specifics. These two examples were the most successful at capturing what needs to happen to factor a basic trinomial in the a^2+bx+c form.  Both capture the essence of the procedure in very different ways. One is verbal and the other is expressed with tables. We shared in class to help everyone get better at documenting their thinking. 


Sunday, October 25, 2015

Snapshot: 8A Applying Systems of Equations


The eighth grade is working hard to develop their algebraic tool box. They are learning the different tools used to solve systems of equations. We have practiced substitution, graphing and elimination. The class's tool of choice is elimination!  

To help us synthesize our learning, we set out to figure out which tools worked best in different scenarios. Each group was given a pair of equations to solve. They had to graph the solution, use substitution to solve the system, and use elimination to solve the system. We discussed and identified characteristics of each set of problems to help us determine which was the best tool for each scenario. Below, are the notes from our exploration. 

Our greatest challenge in this work has been keeping track negative signs, applying the distributive property, and correctly manipulating equations according to the reverse of the order of operations. 


Saturday, September 26, 2015

Snapshot: 7A Variables & Expressions

The seventh graders are grappling with making the leap from concrete numbers to abstract algebraic symbols. This transition is developmental and is nurtured by regular exposure to patterns and looking for connections to the concrete examples. This week, 7A was working out the concept of like algebraic terms. How is x different than an x squared? What does 2x mean? How do we do operations on like and unlike terms?  These the foundation the algebra that is to come.